Up: survey-nonresponse Prev: week2-nonresponse-in-various-survey-modes Next: week4-increasing-response-rates-advanced-letters-and-contact-attempts
Reading Notes:
groves, peytcheva (2008) — the impact of nonresponse rates on nonresponse bias
- Nonresponse bias occurs when nonrespondents have characteristics that systematically skew survey results, making them unrepresentative of the target population.
- The article investigates whether nonresponse rates predict nonresponse bias and identifies conditions under which bias occurs.
-
Key Findings:
-
Relationship Between Nonresponse Rates and Bias:
- Nonresponse rates are a poor predictor of nonresponse bias. Studies show significant variation in bias even among surveys with similar nonresponse rates.
- High nonresponse rates do not necessarily lead to high bias; bias depends on the relationship between survey variables and participation decisions.
-
Factors influencing nonresponse bias:
- Survey Design
- Prenotificaiton and incentives increase response rates but generally do not reduce bias.
- Survey sponsorship: Surveys where the sample has prior involvement with the sponsor (hospital surveys sent to patients) tend to have lower bias.
- Data-collection mode: Interviewer-administered surveys produce higher bias than self-administered surveys.
- Population Characteristics:
- General population surveys exhibit higher bias tan surveys of specific populations
- Urbancity or majority/minority status of the sample does not significantly affect bias.
- Survey Estimate Characteristics:
- Attitudinal measures show higher bias than behavioral or demographic measures.
- Variables highly relevant to the survey topic may be more prone to bias, though this finding is inconclusive.
- Differences between subclass means (comparing two groups) do not generally cancel out bias.
- Survey Design
-
Bias Estimation Methods:
- Screener interviews and follow-up studies report higher bias than studies using sampling frame or supplemental data. This may reflect survey variables influencing participation or measurement errors from different data collection modes.
- Leverage-Salience Theory: Participation decisions depend on the interaction between the salience of survey features (topic or purpose) and individual’s valuation of those features (leverage). For example, in an alcohol use survey, both teetotalers and heavy drinkers may be less likely to respond, leading to bias.
-
-
Conclusions and Recommendations
- Nonresponse bias should be studied at the level of individual measures, not the survey level, as bias varies across estimates within a survey.
- High response rates reduce bias risk but only when participation causes are uncorrelated with survey variables.
- Subclass mean
Lecture Notes:
Survey Response Rate
- AAPOR Standardized Outcome Rates
- AAPOR Standard Definitions Document
- Conservative means if we are not sure about a case, we take it as a no
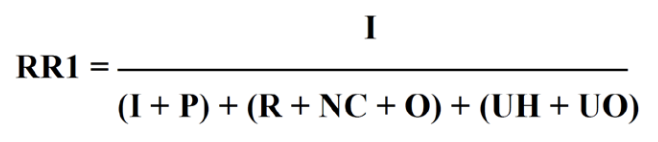
- RR: Response rate
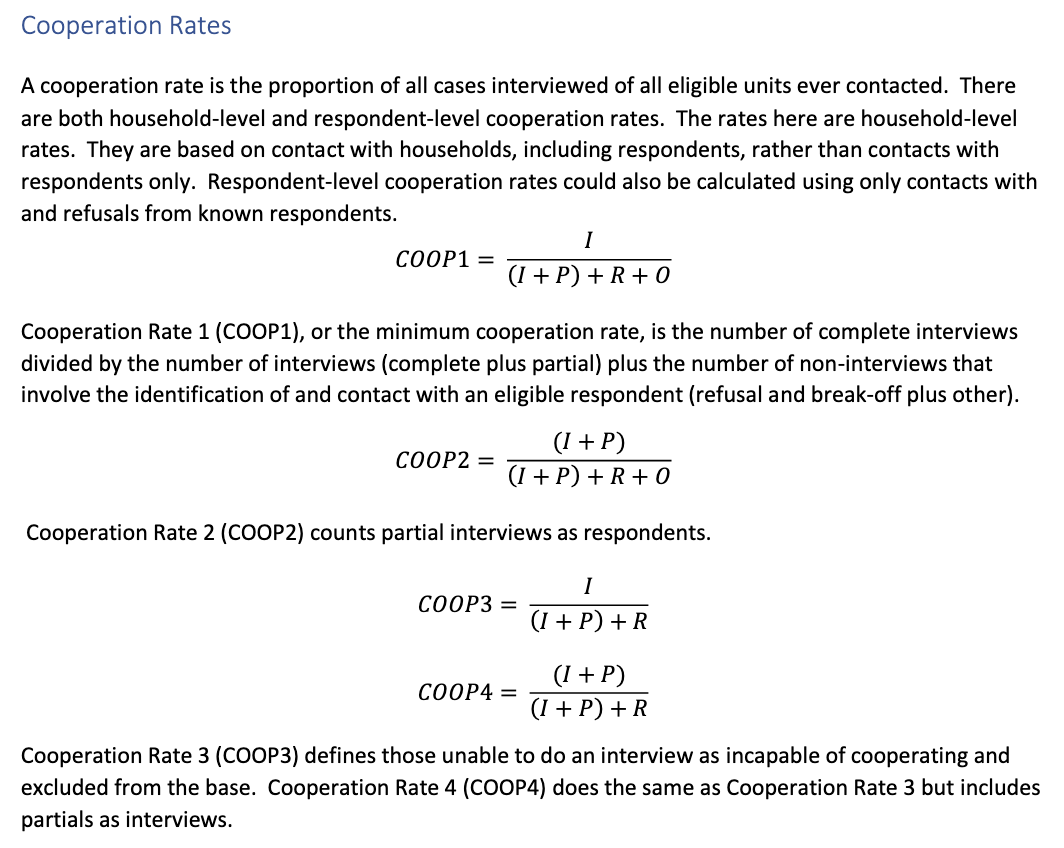
- COOP: Cooperation rate
- REF: Refusal rate
- CON: Contact rate
- I: Complete interview (80-100%)
- P: Partial interview (50-80%)
- R: Refusal or break-off
- NC: Non-contact
- O: Other (can be forgetfulness, )
- UH: Unknown if household/occupied HU
- UO: Unknown other (complex situation, but the interviewer was at the place that day)
- e: Estimated proportion of cases of unknown eligibility that are eligible (country specific estimates, fixes some connectivity issues)
Cooperation Rates
Refusal Rates
Standard Definitions Booklet (p.87)
Contact Rates
A contact rate measures the proportion of all cases in which some responsible member of the housing unit was reached by the survey. The rates here are household-level rates. They are based on contact with households, including respondents, rather than contacts with respondents only. Respondent-level contact rates could also be calculated using only contact with and refusals from known respondents.
𝐶𝑂𝑁1 = (𝐼+𝑃) + 𝑅 + 𝑂 (𝐼 + 𝑃) + (𝑅 + 𝑁𝐶 + 𝑂) + (𝑈𝐻 + 𝑈𝑅 + 𝑈𝑂)
Nonresponse Bias
Glossary:
-
Gross Sample: The total, initial amount you collect from a larger material or population. It’s the unprocessed sample before any reduction or selection. Ideally, it should be a representative miniature of the whole thing you’re analyzing.
-
Net Sample: The smaller, more refined portion that you actually use for analysis. It’s wat remains after the gross sample has been reduced in size and often homogenized to be suitable for the specific analytical method. The goal is for the net sample to still accurately represent the original gross sample’s composition.
-
Nonresponse has two consequences:
- It increases standard error, confidence intervals go huge. So it effects the precision.
- It also effects the accuracy, representation and bias.